🗑️ Garbage Level Monitoring System (GLMS)

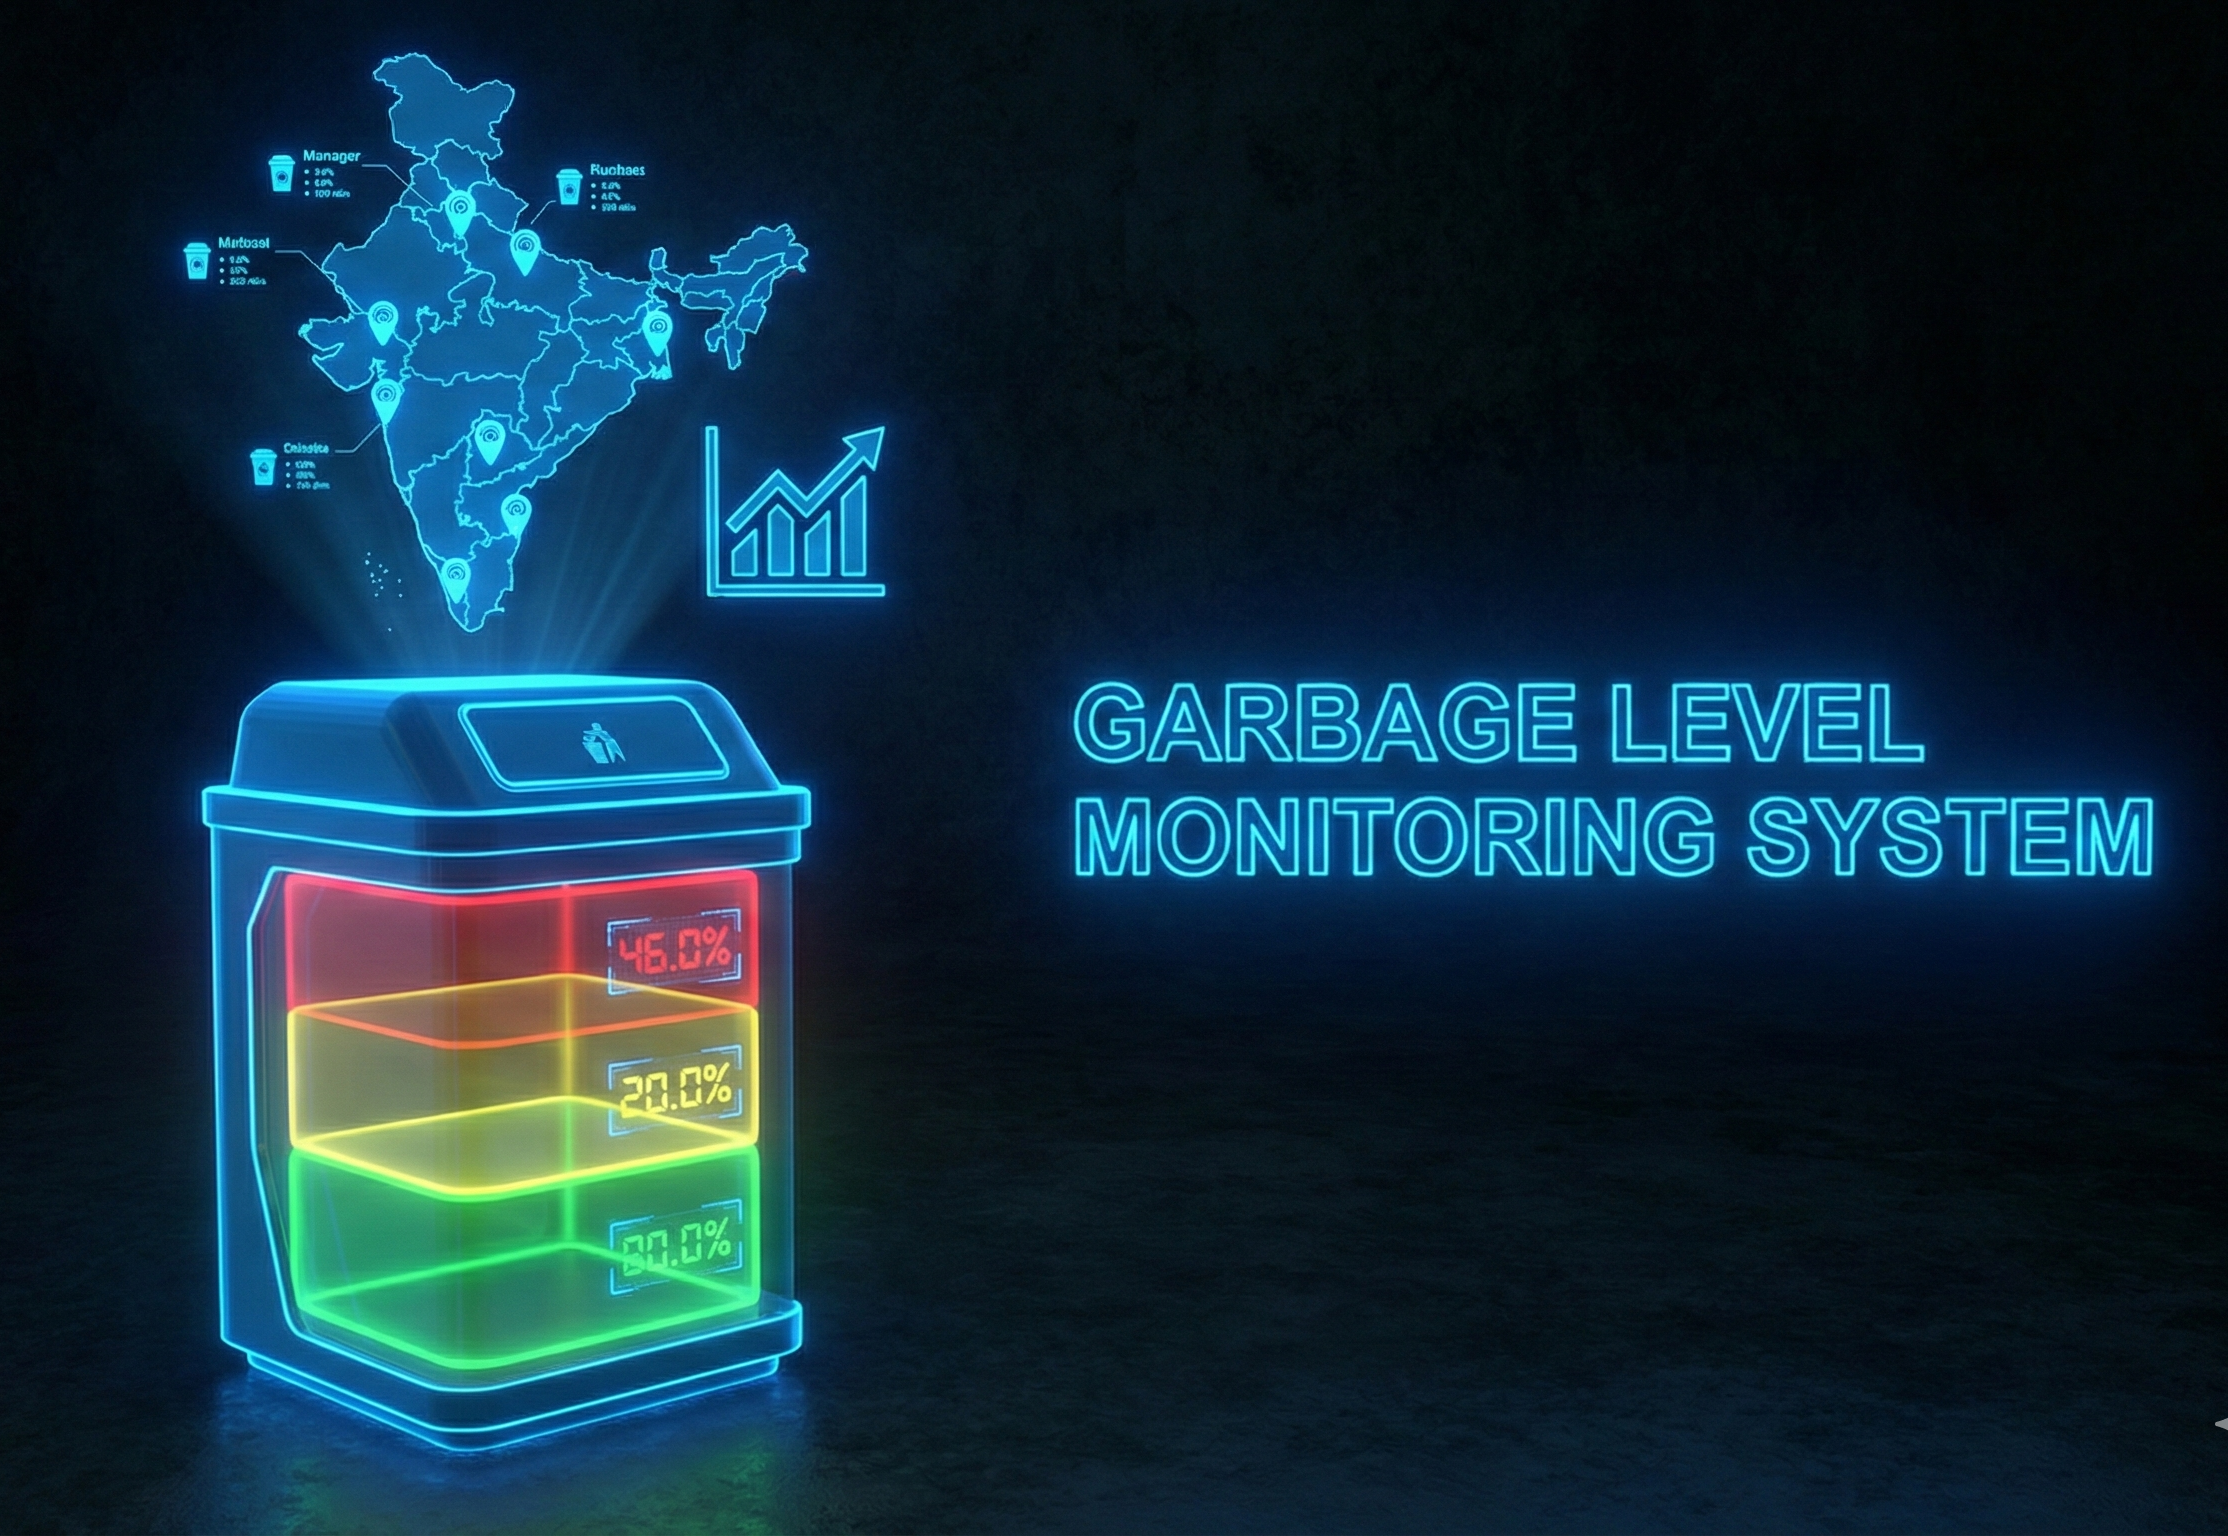
IoT-based smart waste management solution for Indian cities with real-time monitoring across 8 major metropolitan areas

Face Recognition Attendance System
View Code View Results

📋 Problem Statement

Indian cities face severe waste management challenges with rapidly growing urban populations generating increasing amounts of garbage, inefficient collection schedules leading to overflowing bins and public health hazards, traffic congestion preventing timely waste collection in dense metropolitan areas, lack of real-time visibility into bin fill levels resulting in unnecessary collection trips or missed collections, environmental pollution from inefficient waste disposal and transportation, and significant operational costs for municipal corporations managing waste across sprawling urban landscapes. Traditional waste management relies on fixed schedules without considering actual bin capacity, leading to resource wastage, citizen complaints about overflowing bins, and missed opportunities for route optimization in traffic-heavy Indian cities.

There is a critical need for an IoT-enabled smart waste management system specifically designed for Indian urban contexts that provides real-time monitoring, predictive collection scheduling, and route optimization capabilities. This project addresses these challenges by developing a comprehensive Django-based Garbage Level Monitoring System featuring real-time IoT sensor integration across 8 major Indian cities (Delhi, Mumbai, Bangalore, Kolkata, Chennai, Pune, Jaipur, Srinagar), city-specific waste pattern algorithms accounting for office hours (8-10 AM, 6-8 PM peaks), tourist influx, and weather variations, color-coded priority system (Green 0-60%, Yellow 61-80%, Red 81-100%) aligned with Indian waste management standards, RESTful API endpoints for sensor data ingestion with JSON responses and validation, auto-refreshing dashboard with Chart.js visualizations for municipal decision-making, and SQLite/MySQL backend supporting Smart Cities Mission initiatives, enabling Indian municipalities to optimize collection routes, reduce fuel consumption in congested traffic, minimize carbon footprint, and improve public health outcomes through data-driven waste management.

🛠️ Implementation

Django IoT Architecture

The system is built on Django 5.1.4 framework with Python 3.8+, implementing a complete IoT pipeline: ultrasonic sensors (simulated via simulate_sensors.py) measure bin fill levels every 30 seconds, RESTful API endpoint (/api/{bin_id}/{level}/) receives sensor data with JSON responses and validation, Django ORM processes and stores readings in SQLite (development) or MySQL (production) database with two core models (Dustbins for city locations, Readings for sensor data with timestamps), and real-time dashboard auto-refreshes every 10 seconds displaying live data across 8 Indian metropolitan areas with Chart.js visualizations and Bootstrap 3 responsive interface.

Django 5.1.4 Python 3.8+ SQLite/MySQL Bootstrap 3 Chart.js RESTful API

Indian Cities Smart Algorithms

The system implements city-specific intelligence: Delhi/Mumbai patterns with high density and frequent collection requirements for dense urban cores, Bangalore/Pune IT city algorithms detecting office hour waste cycles and tech campus patterns, Kolkata/Chennai traditional city patterns with dense population considerations, Jaipur tourist city logic with seasonal variations during peak tourist seasons, Srinagar weather-dependent patterns with lower baseline and climate considerations. Peak hour detection identifies 8-10 AM morning rush and 6-8 PM evening rush based on Indian office hours and commute patterns. The color-coding system uses Green (0-60%) for normal status, Yellow (61-80%) for monitoring, and Red (81-100%) for urgent collection aligned with Indian municipal standards.

Real-time Monitoring Dashboard

The interactive web interface features live monitoring cards for each of 8 Indian cities showing current fill levels, location names (Connaught Place Delhi, Marine Drive Mumbai, Brigade Road Bangalore, Park Street Kolkata, Anna Salai Chennai, MG Road Pune, City Palace Jaipur, Dal Lake Srinagar), color-coded status indicators, and last updated timestamps. Chart.js provides real-time data visualization with trend analysis. Management commands (update_indian_data) generate realistic data based on actual Indian city patterns. The system includes IoT simulation script for testing, CSRF protection, user authentication, Django admin panel access, and Asia/Calcutta timezone configuration for Indian Standard Time.

💡 Use of This Project

Municipal & Government

  • Municipal Corporations: Delhi, Mumbai, Bangalore city waste management with real-time monitoring
  • Smart City Mission: Government of India Smart Cities initiative implementation for IoT-enabled services
  • Route Optimization: Reduce fuel consumption and traffic congestion with data-driven collection routes
  • Cost Reduction: Minimize unnecessary trips and optimize workforce deployment across Indian metros
  • Public Health: Prevent overflowing bins and improve sanitation in densely populated urban areas

Commercial & Infrastructure

  • IT Parks: Bangalore, Pune, Hyderabad tech campuses with office hour waste pattern tracking
  • Metro Stations: Delhi Metro, Mumbai Local train stations with high-volume waste monitoring
  • Shopping Districts: Connaught Place, Brigade Road commercial areas with peak hour detection
  • Tourist Areas: Jaipur heritage sites, Kashmir valley with seasonal variation handling

Analytics & Research

  • Waste Pattern Analysis: Study city-specific waste generation trends for urban planning
  • Environmental Impact: Monitor carbon footprint reduction through optimized collection
  • Peak Hour Detection: Identify 8-10 AM and 6-8 PM waste generation patterns
  • Seasonal Variations: Track festival impact (Diwali, Holi) and monsoon considerations

📊 Results

🗑️ Indian Cities
8
Delhi, Mumbai, Bangalore
Kolkata, Chennai, Pune
Jaipur, Srinagar
Live Monitoring
📡 IoT Integration
30s
Sensor Update Interval
RESTful API
JSON Responses
Real-time
🎨 Priority System
3 Levels
Green: 0-60% Normal
Yellow: 61-80% Monitor
Red: 81-100% Urgent
Smart Alerts
🔄 Auto-Refresh
10s
Dashboard Updates
Chart.js Visualization
Live Data Stream
Responsive

System Achievements

  • 8 Major Indian Cities: Real-time monitoring across Delhi, Mumbai, Bangalore, Kolkata, Chennai, Pune, Jaipur, Srinagar
  • City-Specific Algorithms: Custom waste patterns for IT cities, tourist areas, and traditional metros
  • IoT Sensor Integration: RESTful API with JSON responses and 30-second simulation updates
  • Smart Color Coding: Three-tier priority system (Green/Yellow/Red) for Indian waste management
  • Peak Hour Detection: 8-10 AM and 6-8 PM patterns based on Indian office hours
  • Real-time Dashboard: Auto-refresh every 10 seconds with Chart.js visualizations
  • Indian Standard Time: Asia/Calcutta timezone with current timestamps (January 2026)
  • Management Commands: update_indian_data for realistic data generation and testing

Technical Specifications

  • Framework: Django 5.1.4 with Python 3.8+ and Django ORM for database operations
  • Database: SQLite (development) and MySQL (production-ready) with two models (Dustbins, Readings)
  • API Endpoint: GET /api/{bin_id}/{level}/ with JSON response and validation (level 0-100)
  • Frontend: Bootstrap 3 responsive framework with Chart.js for real-time visualization
  • Security: CSRF protection, Django authentication, SQL injection prevention, XSS protection
  • IoT Simulation: simulate_sensors.py with 30-second intervals and realistic city-based patterns
  • City Coverage: 8 Indian metros with location-specific data (Connaught Place, Marine Drive, etc.)
  • Timezone: Asia/Calcutta (IST) with current timestamps and peak hour detection

Live System Capabilities

  • Real-time Monitoring: Live dashboard with bin locations and current fill levels for all 8 cities
  • Color-coded Alerts: Visual indicators (Green/Yellow/Red) for immediate priority assessment
  • Time-based Patterns: Waste level changes based on Indian city rhythms and office hours
  • API Integration: Easy sensor data ingestion with curl testing and browser access
  • Data Visualization: Interactive charts showing trends and patterns for each city
  • Auto-refresh UI: Dashboard updates every 10 seconds without manual refresh
  • Management Tools: Django admin panel and custom commands for data management

Future Enhancements (India-Specific)

  • More Cities: Expand to Hyderabad, Ahmedabad, Lucknow, Bhopal for wider coverage
  • Regional Languages: Hindi, Tamil, Bengali interface support for field workers
  • Festival Impact Analysis: Diwali, Holi waste pattern tracking and predictions
  • Monsoon Integration: Weather-based collection adjustments for rainy season
  • Traffic Integration: Indian traffic patterns for optimized route planning
  • WhatsApp Alerts: Integration with WhatsApp Business API (popular in India)